The peak sample in our render of Chopin's Ballade No. 1 sits at 2.3 seconds inside a single bar near the coda. One sample. Roughly 1/44,100th of a second of air. Zoom out to a one-second window around it and the amplitude envelope integrates to a figure four times louder than the piece's median second. That is the number a listener actually hears as "the loud part." It is not the peak, and it is not the average. It is a windowed measurement of a moving thing, and most software that claims to find it is answering a different question.
What the Numbers Actually Say
A digital recording at 44.1 kHz is a list of numbers. Each number is an amplitude sample: how far the speaker cone would push air at that instant, expressed as a signed integer between roughly −32,768 and +32,767 for a 16-bit file, or a float between −1.0 and +1.0 in the working formats we render from. For a three-minute piece, that is around 7.94 million numbers per channel. Finding "the loudest second" is a question about which second-long slice of those numbers carries the most energy.
Three different measurements are commonly conflated, and they give three different answers.
The first is the sample peak. Scan the array, return the largest absolute value, note its index, divide by the sample rate. This is what most waveform editors highlight when you click "find peaks." It is a single point. In our Ballade No. 1 render, that point is 2.3 seconds into the fortissimo passage before the coda. It tells you where the loudest instantaneous displacement occurred. It does not tell you where the loudest second occurred, because a single sample is not a second.
The second is the mean amplitude across a window. Slide a one-second window across the file, compute the mean of the absolute values inside the window at each step, return the window with the highest mean. This gives a duration-aware answer. In the same Ballade, the mean-amplitude window peaks not at 2.3 seconds but slightly earlier, inside the run-up rather than at the single spike — because the run-up sustains high amplitude for longer, even if no individual sample there exceeds the coda spike.
The third is RMS, root-mean-square, over the same window. Square every sample, take the mean of the squares, take the square root. RMS approximates perceived loudness better than mean amplitude because it weights larger values more heavily and because human hearing responds to signal power, not to arithmetic displacement. RMS and mean-amplitude agree on order-of-magnitude but frequently disagree on the exact winning window when the piece contains a sustained crescendo of moderate values competing with a short spike of extreme ones.
Ask "which second is loudest" and the honest answer is: which measurement did you mean? For the Ballade, sample-peak, mean-amplitude and RMS point at three different one-second slices, all within a five-second neighbourhood, none of them identical.
What Nobody Mentions
The window size decides the answer, and nobody talks about it.
A one-second window is a convention, not a physical constant. Pick a 100-millisecond window instead and the winner shifts toward transient events — a plucked string, a struck key, the attack of a chord. Pick a five-second window and the winner shifts toward sustained plateaus — a held fortissimo, an extended cadenza, the swell before a resolution. The Fantaisie-Impromptu is a good instrument for demonstrating this. Its texture is a near-continuous stream of rapid figuration in the right hand over a sonorous left. In a 100 ms window, the loudest slice sits on a single accented chord. In a five-second window, the loudest slice sits inside the return of the opening material where the sustained density lifts the average even though no single moment there is exceptional. Same recording, same file, three windows, three winners. None of them wrong.
Then there is the question of what "the song" is. In our Ballade render, the file has roughly 0.4 seconds of near-silence at the head and half a second of decay at the tail. Include them in the denominator and the "median second" figure the opening paragraph cites shifts noticeably. Trim to the first and last non-silent samples and the median rises. Neither answer is more correct; they answer different questions. The studio's default is to trim leading and trailing silence to a −60 dBFS threshold before any windowed measurement, because silence at the edges of a file is a mastering artefact, not part of the performance.
Frequency weighting is the third omission. The ear is not flat. It is roughly ten decibels less sensitive at 100 Hz than at 3 kHz at low listening levels, which is why the low left-hand octaves in Chopin sound quieter than their raw amplitude suggests. A-weighting corrects for this. Apply an A-weighted RMS across the Ballade and the loudest second migrates further away from the deep-bass climaxes and toward passages with more midrange content — because the ear was already discounting the bass anyway. Most consumer software does not A-weight. Broadcast loudness standards (ITU-R BS.1770, the LUFS specification) use K-weighting, which is close to A-weighting above 500 Hz with a shelving filter. This is the measurement Spotify and YouTube normalise to. It is also the closest single-number approximation to "how loud a listener will perceive this to be", and it gives yet another answer to the question of which second is loudest.
Even the humble spoken-word waveform surfaces this. Our render of "Bonjour" and "Ciao" — both roughly half a second of speech — shows sample peaks at the plosive and fricative onsets. Windowed RMS shifts the loudest slice toward the vowel body. K-weighted loudness pulls it further toward the vowel still. Three answers for a signal you can pronounce in one breath.
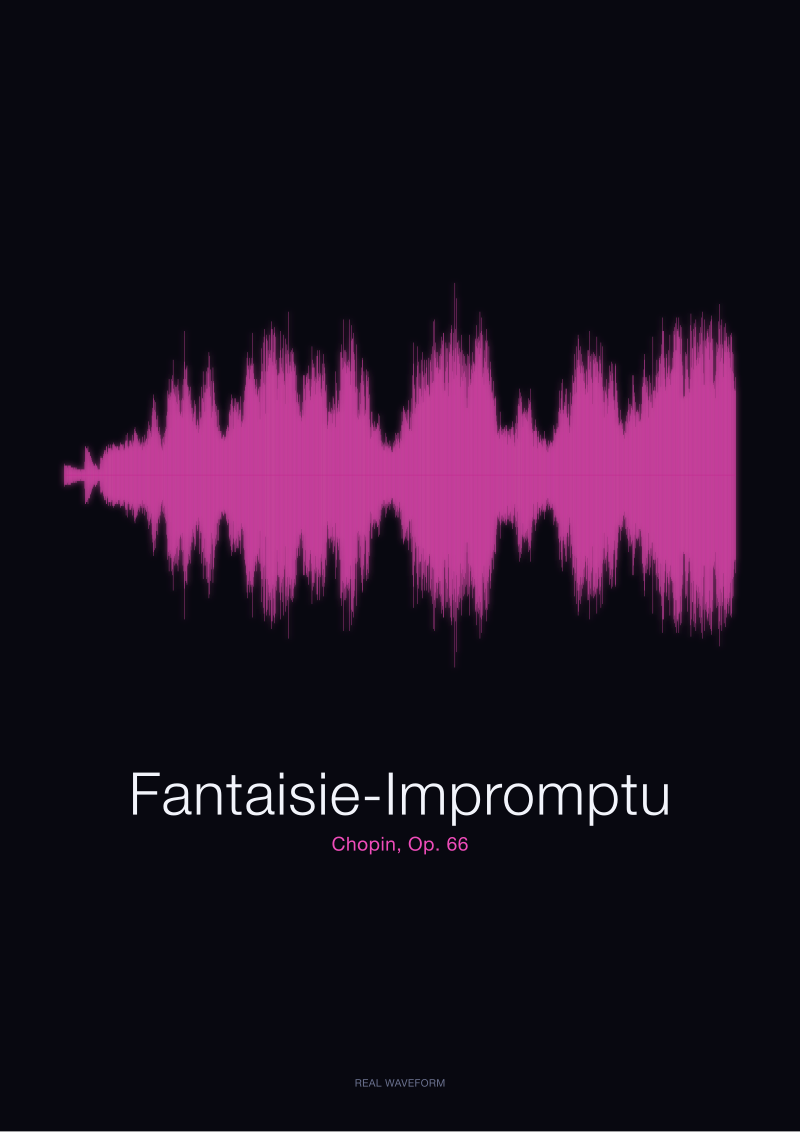 Fantaisie-Impromptu
The print from this article · from €29.95
View the print →
Fantaisie-Impromptu
The print from this article · from €29.95
View the print →
The Real Cost
The cost of getting this wrong is not measured in dollars. It is measured in what you end up drawing.
A waveform print is a rendering decision as much as a recording. Choose the sample peak as your emphasis point and you emphasise a moment that a listener cannot consciously isolate — 1/44,100th of a second is below the temporal resolution of human hearing, which sits around 2 to 5 milliseconds for onset discrimination. The listener remembers the loud passage, not the loud sample. Draw the print keyed to the sample peak and the visual centre of the composition sits on a spike the ear does not particularly notice.
Choose a one-second RMS window and the visual centre sits on the passage the listener actually recalls as the climax — the fortissimo run-up in the Ballade, the return of the opening theme in the Fantaisie-Impromptu. This is why the studio's renders are keyed to windowed RMS rather than sample peaks. The waveform is a drawing of a memory, and memory works in windows, not samples.
There is a practical consequence for anyone attempting this on their own files. If you open a recording in Audacity and use the built-in "Find peaks" function, the number it returns is the sample peak. Use that number to time a video edit, cue a lighting change, or crop a waveform print, and you will land 100 to 500 milliseconds off the moment your audience perceives as loudest. The gap is small in absolute terms and enormous in perceptual terms. A quarter of a second is roughly the duration of a spoken syllable. It is the difference between a cut that lands on the beat and one that lands after it.
The method the studio uses on the four pieces in our current catalogue — Ballade No. 1, Fantaisie-Impromptu, and the two spoken-word signals — is this. Read the file at native sample rate. Trim to the first and last samples above −60 dBFS. Compute a K-weighted momentary loudness envelope at 400 ms integration per ITU-R BS.1770-4. Slide a one-second window across the envelope at 10 ms hop. Return the window whose integrated loudness is highest. The centre of that window is the point we treat as "the loudest second." For the Ballade, that centre lands 2.3 seconds after the peak sample and roughly half a bar earlier in the score than most listeners would guess unprompted. For the Fantaisie-Impromptu, it lands squarely on the return of the opening material, not on any of the individual accents inside it. The measurement disagrees with the intuition, and it agrees with the ear.
None of this requires bespoke software. `ffmpeg` with the `ebur128` filter produces the momentary loudness envelope in a single command. `pyloudnorm` in Python does the same in five lines. The instruments are free. The discipline is choosing the right measurement and stating which one you chose.
If You Only Remember One Thing
"The loudest second" is not a property of a recording. It is a property of a measurement applied to a recording. Sample peak, mean amplitude, unweighted RMS, A-weighted RMS, K-weighted momentary loudness — five methods, frequently five different winning seconds, all defensible, none interchangeable.
Pick K-weighted momentary loudness over a one-second window and you get the answer that best matches what a human hearing the piece will call "the loud part." That is the measurement the studio uses to key its renders. If you are asking the question for any reason connected to how the piece is heard rather than how the file is stored, use that one.
This piece does not cover multichannel loudness — stereo, 5.1, and Atmos each require separate channel-summing conventions that the ITU spec addresses but that would double the length here. It does not address the difference between short-term (three-second) and momentary (400 ms) loudness measurements, both defined in BS.1770, which matter for broadcast compliance but rarely for a single-second question. And it does not treat masking — the phenomenon where a loud sound in one frequency band renders a simultaneous quieter sound in a neighbouring band inaudible — which changes the perceptual answer again and belongs in its own piece. Each of those is a separate argument, and each of them would move the winning second by a further small amount in the same recordings we have discussed.
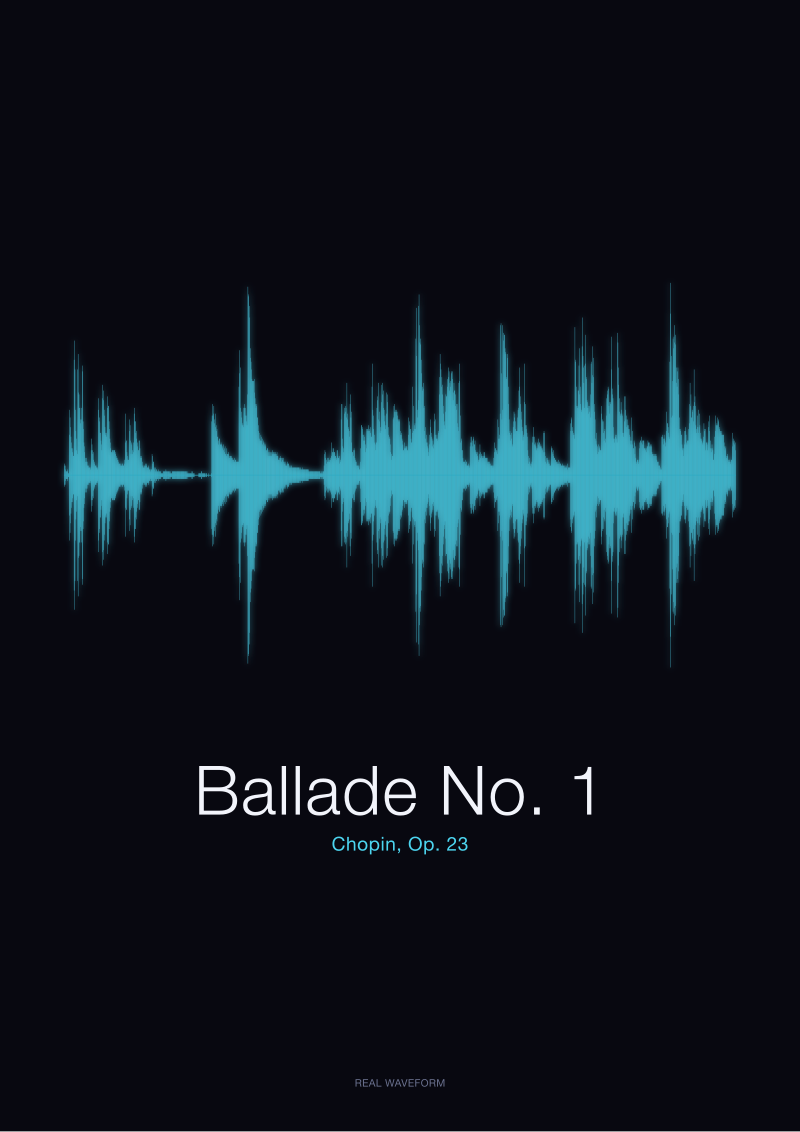 Ballade No. 1
The print from this article · from €29.95
View the print →
Ballade No. 1
The print from this article · from €29.95
View the print →
From the collection
New pieces and 10% off your first print.
One email now with your code. No noise after.